
Data quality metrics are the scores you use to see if your product information is actually fit for purpose. Think of them as a report card for your data, grading crucial dimensions like completeness, accuracy, and consistency to show you what your data is truly worth.
Let's get right to it. Inaccurate, incomplete, or inconsistent product information is silently killing your budget and damaging your brand. Every time a customer can’t find a product because of a typo, or ditches their cart over a vague description, you’re losing money.
This isn't just some minor operational headache; it's a massive financial problem. Industry analysis from Gartner reveals that poor data quality costs the average company a staggering $12.9 million every year. This number hits retail and e-commerce especially hard through wasted operational cycles, customer returns, and flat-out lost sales.
Imagine your entire e-commerce operation is a skyscraper. Your product data is its foundation.
If that foundation is built with incomplete blueprints, wrong measurements, and mismatched materials, how long do you really think the building will stand? Not long at all.
The same is true for your business. Bad data creates cracks everywhere.
A study featured in the Harvard Business Review uncovered a shocking truth. After analyzing 195 different metrics, researchers found that only 3% of companies' data meets basic quality standards. A massive 97% is riddled with errors.
The costs are real, and they add up fast. A single incorrect weight can lead to thousands in shipping chargebacks. One missing compatibility detail can trigger a wave of angry customers and costly returns. You can dive deeper into the fundamentals of what data quality is and why it matters.
This is exactly why measuring data quality isn't just a technical task for your IT department. It’s a critical business strategy.
By turning these abstract problems into hard numbers with data quality metrics, you can finally see the true scope of the issue. It allows you to pinpoint the most expensive problems, focus your resources where they matter most, and start turning your product data from a liability into a powerful asset.
Alright, we’ve talked about the high-level pain of bad product data. Now, let's get our hands dirty. To actually fix the mess, you have to measure it first.
Think of these metrics as the vital signs for your product catalog. They're the core numbers that tell you exactly where things are breaking down. We’ll break down the seven most critical dimensions of data quality, what they mean in plain English, and how to start tracking them.
It's no secret that bad data has a nasty domino effect that hits your wallet and erodes customer trust. The path from one to the other is shockingly direct.
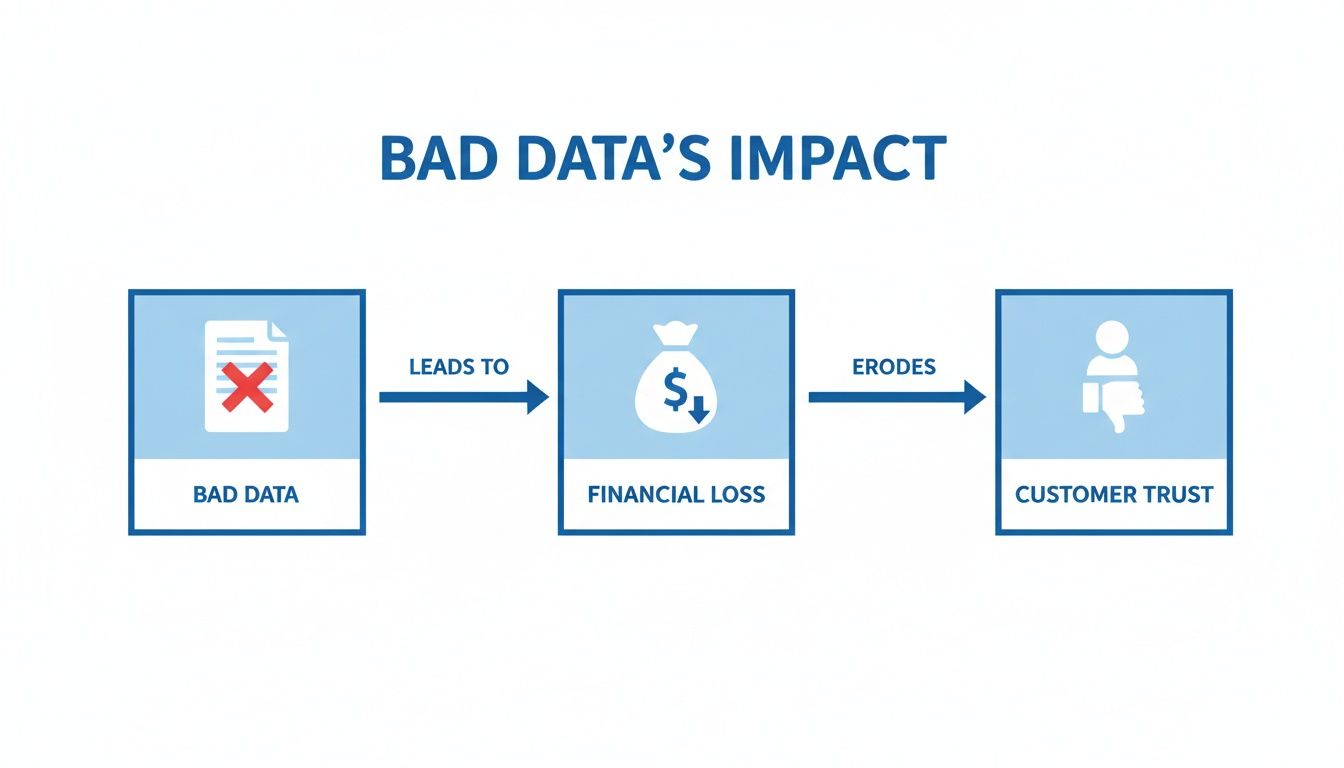
Low-quality data doesn't just create operational headaches; it actively costs you money and pushes your customers away.
Before we dive deep, here’s a quick overview of the seven metrics we’re about to cover. Think of this as your cheat sheet for diagnosing the health of your product data.
| Metric | What It Measures | Why It's Critical for eCommerce |
|---|---|---|
| Completeness | Are all the required fields filled in? | Prevents gaps in the customer journey and provides a full product story. |
| Accuracy | Is the data correct and true to reality? | Builds trust and avoids costly errors like returns or shipping mistakes. |
| Consistency | Is the data the same across all systems? | Eliminates customer confusion and ensures a single source of truth internally. |
| Uniqueness | Are there any duplicate records? | Prevents a bloated catalog, split reviews, and messy inventory management. |
| Timeliness | Is the data current and up-to-date? | Crucial for real-time decisions like inventory, pricing, and promotions. |
| Validity | Does the data follow the correct format and rules? | Ensures data integrity and prevents system errors from malformed entries. |
| Discoverability | How easily can AI and search engines find and understand the product? | Makes your products visible in an era of AI-powered and conversational search. |
Each of these metrics tells a different part of the story. Let's break down what to look for and how to measure it.
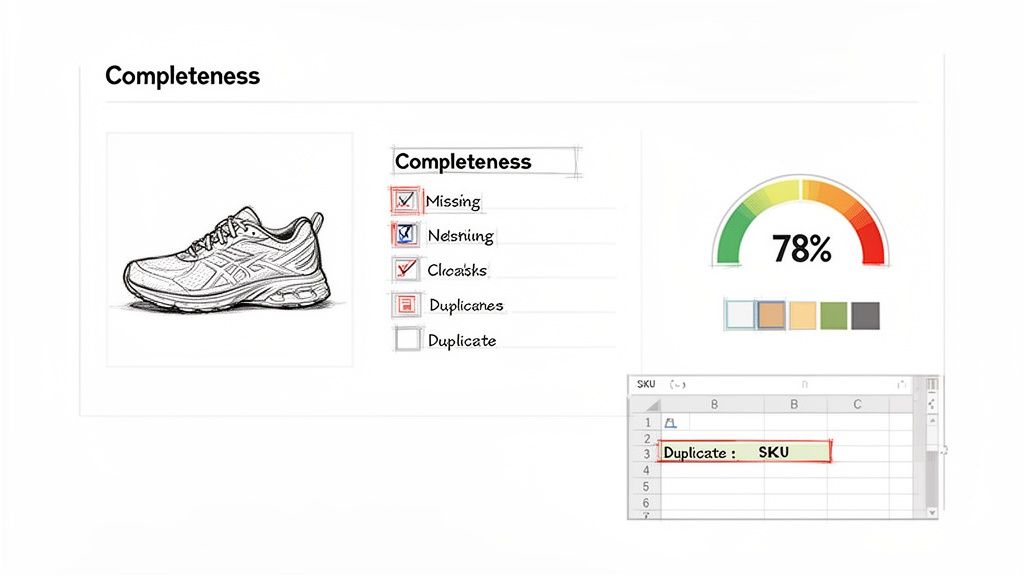
Completeness simply asks, "Is anything important missing?" For any given product, do you have all the essential pieces of information? We’re talking about missing weights, images, key feature bullets, or even basic dimensions.
Every blank field is a potential dead end for a customer. A Forrester study revealed that over a quarter of companies lose more than $5 million annually because of poor data, with simple incompleteness being a huge culprit.
Here's a straightforward way to put a number on it:
Completeness Score = (Number of Populated Fields / Total Number of Required Fields) x 100
For instance, if your "running shoe" template has 20 required attributes but a specific SKU only has 15 filled out, its completeness score is a mediocre 75%.
Accuracy is all about whether your information is actually correct. Does it reflect reality? Is the price right? Is the "blue" shirt in the description actually blue in the main product image?
This is arguably the big one. Inaccurate data flat-out misleads customers, but it also creates a storm of operational chaos. We've seen it all, from shipping disasters because of wrong dimensions to legal trouble over incorrect compliance data.
Calculating accuracy usually means spot-checking your data against a trusted source of truth.
Accuracy Score = (Number of Correct Records / Total Number of Records) x 100
If you audit 100 product weights against the real, physical weights and discover 98 are correct, you’re looking at a 98% accuracy score.
Consistency is about making sure the same piece of information is identical everywhere. If a product is "Men's Trail Runner 2.0" on your website, it shouldn't be "Trail Runner v2 - M" in your ERP and "Mens Trail Running Shoe" on Amazon.
When data is inconsistent, it breeds confusion for everyone, including your internal teams and your customers. It makes getting a single, unified view of your product catalog impossible and leads to countless hours wasted trying to reconcile conflicting details.
Uniqueness is your defense against duplicates. This metric checks that every product, customer, or order exists only once in a given system. Simple as that.
Duplicate product listings are a classic eCommerce headache. They split customer reviews, confuse search engine rankings, and turn inventory management into a nightmare. A high duplicate rate is a sure sign your catalog is bloated and unreliable.
You can measure this with a quick calculation:
Uniqueness Score = ((Total Records - Duplicate Records) / Total Records) x 100
If you have 10,000 SKUs but find 500 are duplicates hiding in the system, your uniqueness score is 95%.
Timeliness measures how up-to-date your information is. Data has a shelf life. An inventory count from last month or a price that was updated a week ago isn’t just useless; it’s actively dangerous to your business.
In fast-moving industries like retail, timeliness is everything. Outdated stock levels lead to overselling and furious customers. Delayed promotional pricing means you're leaving money on the table. This metric is what allows you to be agile and make smart decisions on the fly.
Validity just confirms that your data follows the rules. It’s a gut check to see if data is in the right format and falls within an acceptable range. For example, an email address must have an "@" symbol, and a product's star rating has to be a number between 1 and 5.
Invalid data is like sand in the gears. It breaks automated workflows and pollutes your entire database. This problem usually starts with weak data entry controls and snowballs into a massive cleanup project down the road. The best defense is to enforce validity rules at the source.
You can measure it with a simple pass/fail check:
Validity Score = (Number of Valid Records / Total Number of Records) x 100
A newer but absolutely vital metric, discoverability measures how easily your products can be found and understood, especially by AI-powered search engines. This is way beyond old-school SEO. It's about having rich, structured data that can answer complex, conversational customer queries.
Are your attributes tagged so an AI understands that a "5Ah battery" provides "longer runtime"? Is your content descriptive enough for a generative AI to recommend your product with confidence? In a world where customers ask questions instead of just typing keywords, poor discoverability will make you invisible.
Tracking these seven core data quality metrics is the essential first step. It's how you build a product information foundation that actually drives growth instead of holding you back.
Theory is one thing. Seeing how these data quality metrics actually show up and what happens when they go wrong is where it all clicks. The formulas and definitions are just the tools in your toolbox. Let's put them to work and see what they can build.
We’ll walk through a common scenario: launching a new line of running shoes. Each example will show you how one of these metrics can be the difference between a smooth launch and a total disaster.
Let's say you're launching the "CloudStrider 3." Your product template has 25 attributes you consider absolutely essential. We're talking about core specs like weight, heel-to-toe drop, cushioning type, all available colors, and at least five high-res images.
Your team gets to work on a new SKU, the "Men's CloudStrider 3 in Arctic Blue." But in the rush, a few fields get missed. The heel-to-toe drop is blank, and only three of the five required images were uploaded. That leaves you with only 22 out of 25 required fields filled in.
Here's how the math shakes out:
Now, 88% doesn't sound terrible, does it? But that one missing technical spec could be an instant dealbreaker for a serious runner comparing your shoe against a competitor's. And those missing images? They just make the product page look unprofessional and untrustworthy. Even a small data gap can have a big impact on sales.
Accuracy is all about getting the facts right. The factory spec sheet clearly states the CloudStrider 3 weighs 9.2 ounces. But somewhere along the line, a simple data entry typo lists it as 10.2 ounces in your PIM.
That single ounce might seem trivial, but in the performance running world, weight is everything. A competitive runner might set an online filter for shoes under 10 ounces, and just like that, your product is completely invisible to a core segment of your target audience.
An accuracy audit is your defense against this. It’s the process of sampling your product data and checking it against the "source of truth," in this case, the factory's official spec sheet. Finding this error and correcting it from 10.2 back to 9.2 ounces is what ensures your product shows up in the right searches and is represented honestly.
It’s a tiny mistake with huge consequences, highlighting how accuracy directly impacts findability and customer trust.
Your brand has a multi-channel presence. You sell on your own website, on Amazon, and through a network of retail partners. That beautiful new color for the CloudStrider 3 is officially named "Arctic Blue."
But look what happened:
This is a classic consistency nightmare. A customer who sees the shoe on Amazon might search for "Arctic Blue" on your site and come up empty. This mess creates confusion for customers, makes inventory tracking a nightmare, and throws a wrench into any omnichannel marketing efforts. A single, consistent name is non-negotiable.
As you gear up for the launch, you import a big data file from a supplier. Hidden in that file, the "Men's CloudStrider 3 - Size 10" is listed twice. If your system isn't smart enough to flag this, you've just created two separate product records for the exact same item.
This one duplicate can spiral into a whole host of problems. Customer reviews get split between two different product pages, your inventory counts are now completely unreliable, and all your sales analytics are skewed. Measuring uniqueness is what helps you catch these redundant entries before they start polluting your entire product catalog.
This isn't a rare problem, either. Research that monitored over 11 million data tables found that teams typically face about one significant data quality issue for every 15 tables they manage. What's really interesting is that 34% of the incidents flagged weren't even true errors but just the result of normal business changes. It shows why you need smart monitoring, not just a system that screams about every little thing. You can dive deeper into these data quality statistics and trends.
Let's bring it home by looking at how the last three metrics fit into our shoe launch.
Timeliness: You've planned a big price drop for launch day to build some buzz. But if the price update in your system is delayed by even a couple of hours, you'll miss out on that critical initial sales momentum. Timeliness ensures your data reflects real-world events as they happen.
Validity: Your PIM has rules. The price field, for instance, must be a number with two decimal places (e.g., 99.00). If someone tries to type "Ninety-Nine Dollars," a validity rule should immediately block the entry. This prevents bad data from ever entering the system and causing errors downstream.
Discoverability: A potential customer asks their smart speaker, "Find me a lightweight, neutral running shoe for marathon training." Your CloudStrider 3 is a perfect fit, but only if its attributes are structured in a way that an AI can understand that "9.2 oz" means "lightweight" and "Max Cushion" is good for long distances.
These examples aren't just academic exercises. They show that data quality metrics are practical health checks for your business. They directly influence your operations, your customer's experience, and most importantly, your bottom line.
Trying to manually track data quality metrics across thousands of products is an impossible task. It’s like trying to count every raindrop in a storm. This is where a modern Product Information Management (PIM) platform becomes your secret weapon.
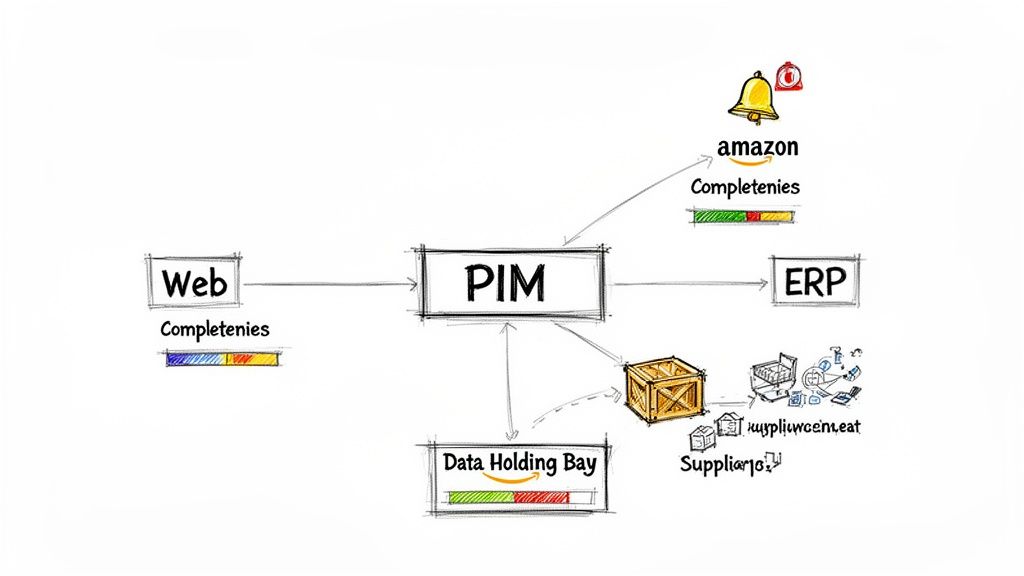
A PIM acts as the central hub, becoming the single source of truth that governs the quality of data flowing out to every channel. It’s a system that transforms data quality from a reactive, frustrating chore into a proactive, automated process.
The struggle to keep data clean is only getting tougher. In 2026, 64% of organizations called data quality their top integrity challenge, a huge jump from just 50% the year before. The same research points to a lack of automated tools as the single biggest barrier, which is exactly the problem a dedicated PIM is built to solve.
Instead of getting lost in spreadsheets, a PIM like NanoPIM gives you a live dashboard, a real-time health check for your entire product catalog. These dashboards provide an at-a-glance view of the metrics that matter most.
You can instantly see your overall completeness score, identify which product categories are falling behind, and spot negative trends before they snowball into major problems. This kind of visibility is the first step toward taking back control.
Moving from messy spreadsheets to a central command center is a foundational shift. Implementing an Ecommerce Product Information Management (PIM) system is a strategic move to centralize and automate this entire process.
One of the most powerful functions of a PIM is its ability to act as a gatekeeper. It simply stops bad data from ever polluting your live channels.
For example, a Data Holding Bay lets you safely import new data files from suppliers or other systems into a quarantined staging area. Here, the PIM can analyze the new data against your existing records, automatically flagging any errors, duplicates, or inconsistencies.
You get a chance to review and approve the changes before they are merged into your master catalog. This simple step prevents thousands of potential errors from ever reaching your customers, saving countless hours of cleanup work down the road.
This controlled environment is a core part of what a PIM does. If you're new to the concept, our guide explaining what a PIM system is and how it works is a great place to start.
Manually enforcing consistency across a large catalog is a recipe for failure. A PIM automates this with features like prototypes and cascading attributes. You can set up a "master" template for a product type, and any changes you make to that template automatically flow down to all associated products.
If you change a brand name for a product line, you do it once. The PIM takes care of updating it everywhere, guaranteeing consistency without the manual effort.
Finally, a PIM can actively monitor your data quality metrics and send automated alerts when something goes wrong.
This allows your team to manage by exception. Instead of constantly hunting for problems, you can trust your system to tell you when your attention is actually needed. It’s about moving from a state of constant worry to one of confident control.
Not all sales channels are created equal. This is a hard truth in e-commerce. The data quality you need for your own website is often worlds apart from what a marketplace like Amazon, a Google Shopping feed, or a B2B distributor portal demands. A one-size-fits-all approach to data quality simply won’t cut it.
This is where setting channel-specific thresholds becomes your secret weapon. Instead of chasing a mythical 100% on every metric across the board, you tailor your goals to the specific requirements of each channel. This lets you focus your team’s energy where it will actually move the needle on visibility and sales.
Think about the different rulebooks for each channel. Your own website is your kingdom; you have total creative freedom. But selling on a major marketplace means playing their game by their rules, and those rules are often incredibly strict.
For example, Amazon might require 95% completeness on core attributes just for a product to show up in search results. If you don't hit that mark, your product might as well be invisible. On the other hand, your internal ERP system might work just fine with 80% completeness, since its main job is tracking inventory and financials, not convincing a customer to click "buy."
A smart multi-channel strategy means you stop asking, "Is our data good?" and start asking, "Is our data good enough for this specific channel?" This shift in thinking is critical for optimizing your content without burning out your team.
This approach helps you prioritize your resources where they matter most. Instead of trying to perfect every last attribute for every system, you can focus on nailing the high-stakes requirements for your key sales channels first. You can dive deeper into building a cohesive plan by exploring our guide on data management strategy.
Setting these different standards begins with understanding what each channel truly needs to perform. The best way to do this is by creating a simple ruleset for your most important endpoints.
Here’s what that might look like in the real world:
Amazon Marketplace:
Your E-commerce Website:
Internal ERP System:
Once you’ve defined these rules, you can create formal Service Level Agreements (SLAs) for your data teams. SLAs make the expectations crystal clear and give everyone a concrete target to hit.
A PIM platform is the ideal place to enforce these different standards automatically. You can build channel-specific templates and completeness scores right into the system. It can then flag a product destined for Amazon because it's missing a required attribute, while knowing that same product is perfectly fine for your internal catalog. This empowers you to optimize strategically, ensuring you meet compliance and maximize your visibility everywhere you sell.
Alright, you've seen the metrics and you know what good data looks like. Now what? It's easy to get overwhelmed, but improving your data quality isn't about boiling the ocean.
Let’s build a simple, practical plan to turn that messy product information into your most valuable asset.
First things first: run a quick audit. Don't try to tackle your entire catalog. Pick one small, high-impact product line, maybe a bestseller or a new launch, and score it against the data quality metrics we just covered.
Focus on completeness and accuracy. These almost always deliver the fastest, most visible wins.
Once you have your scores, pinpoint the one or two metrics that are causing the most pain. Are missing images (completeness) tanking your conversion rates? Maybe incorrect product weights (accuracy) are creating a nightmare of shipping errors and customer complaints.
Whatever it is, pick that one problem and solve it for that one product line. That's it.
The goal here is to get a quick, undeniable win. Fixing a real, tangible problem creates a powerful mini-case study. This builds momentum and makes it infinitely easier to get the buy-in you need for bigger data quality projects.
For example, imagine showing your team how improving the completeness score from 70% to 95% for just your top 10 products led to a measurable lift in sales. That’s how you start building a rock-solid business case for tools like a PIM.
Now, connect your audit findings to real dollars and cents. Don't just say the data is "inaccurate." Show what that inaccuracy costs.
Frame it in terms your leadership team can't ignore:
When you do this, you're no longer talking about abstract data cleanup. You're talking about saving money, increasing revenue, and gaining a competitive edge.
This is the path. You're not just organizing spreadsheets; you're building a clear, actionable strategy to make your product information work for you.
Diving into the world of product information always brings up a lot of questions. Here are some of the most common ones we hear from ecommerce and product managers, with straightforward, practical answers.
This is a big one, but the distinction is pretty simple. Think of it this way:
Data quality is the condition of your data. It’s what you’re measuring with metrics like accuracy and completeness to see if your product info is actually good enough to do its job.
Data governance, on the other hand, is the system you build to get and keep that quality. It’s the combination of people, rules, and technology that makes sure your standards are met. Governance is how you get good data; quality is the score that tells you if you’re winning.
A PIM system is the perfect example of a tool inside a data governance strategy. It’s what enforces the rules that keep your data quality scores high everywhere you sell.
If your data is a mess, the absolute worst thing you can do is try to fix everything at once. That's a surefire way to get completely overwhelmed.
Instead, pick one fight. Focus on the single metric that's causing your business the most pain right now.
For most online stores, that metric is almost always Completeness. Are your best-selling products missing images? Do they lack the specs or compatibility info a customer needs to click "buy"? That's a huge, immediate problem.
Start there. Use a simple spreadsheet or your PIM dashboard to grade the completeness of your top 20 products. Fixing just that one metric for a small group of high-impact items will give you a fast, tangible win. It also helps you build momentum and prove the case for a larger data quality project.
There's no single right answer. It depends on the metric and the pace of your business. Some metrics need constant attention, while others are more of a weekly or monthly check-in.
Metrics like Timeliness for a flash sale or a new product launch demand real-time monitoring. You need to know now if something is wrong.
Broader catalog health scores, like overall Completeness or Consistency, can usually be reviewed weekly or monthly. The best way to manage this is with an automated system, like a PIM, that gives you a live dashboard. This way, you can spot troubling trends and get alerts for any sudden drops without having to pull manual reports all the time. To put these concepts into practice and improve data quality, consider implementing some of the 10 Essential Data Cleaning Best Practices.
Ready to stop reacting to data problems and start preventing them? NanoPIM gives you the automated dashboards, alerts, and governance tools to turn your product information into your biggest competitive advantage. Explore how we can help at https://nanopim.com.


