
Let's cut right to it. Data quality is just a measure of how reliable and useful your information is for whatever you need it to do. Think of it like baking. High-quality data is like using fresh, perfectly measured ingredients. You get a delicious, predictable result every time. It gives you the confidence to launch products, manage inventory, and actually understand your customers.
Imagine you’re an eCommerce manager gearing up for a massive holiday sale. You've sunk weeks into planning your marketing and getting the team aligned. Then, on launch day, half of your best-sellers show up with the wrong prices. Others are listed as "in stock," but your warehouse is completely empty.
That chaotic nightmare? That's low-quality data in action.
Data quality isn’t some abstract IT buzzword. It's a direct measure of how fit your data is for making real-world business decisions. When your data is high-quality, it means it's accurate, complete, and trustworthy. You can count on it to tell you the truth about your inventory levels, customer addresses, and product specs.
Data quality is the bedrock of confident decision-making. It’s the difference between guessing what your customers want and knowing what they’ll buy next. Good data takes the guesswork out of the equation, slashes costly mistakes, and gives your entire team a single source of truth to rally around.
This becomes absolutely critical when you're selling across multiple channels. Your product data needs to be perfect not just on your website, but also on Amazon, Google Shopping, and every other marketplace you're on. A single inconsistency can torpedo sales, frustrate customers, and even get you penalized by the platforms themselves.
To give you a clearer picture, here’s a quick snapshot of what good and bad data look like in the wild.
This table makes it obvious: one side builds customer trust and drives sales, while the other creates chaos and erodes your brand.
So, what does this actually mean for your bottom line? High-quality data creates a positive ripple effect that touches every part of your operation.
Ultimately, focusing on data quality is about building a more resilient and profitable business. It’s a core piece of a strong data management strategy, ensuring every decision you make is built on solid ground. A great first step is to explore a solution for master data management that can bring much-needed order to your information chaos.
We all talk about wanting “high-quality data,” but what does that actually mean? It's not some vague, abstract goal.
Think of it like a quality check for a brand-new car. You wouldn't just make sure the engine starts. You'd inspect the brakes, the tires, the paint job, the electrical systems, and everything else. Each component has to be right for the car to be considered high-quality and safe.
It's the same with your data. “Data quality” is a combination of several distinct characteristics, or dimensions. Once you understand these six core dimensions, you can stop guessing what's wrong with your product information and start diagnosing problems with real precision.
This concept map gives a quick visual overview of the good that comes from quality data and the bad that comes from neglecting it.
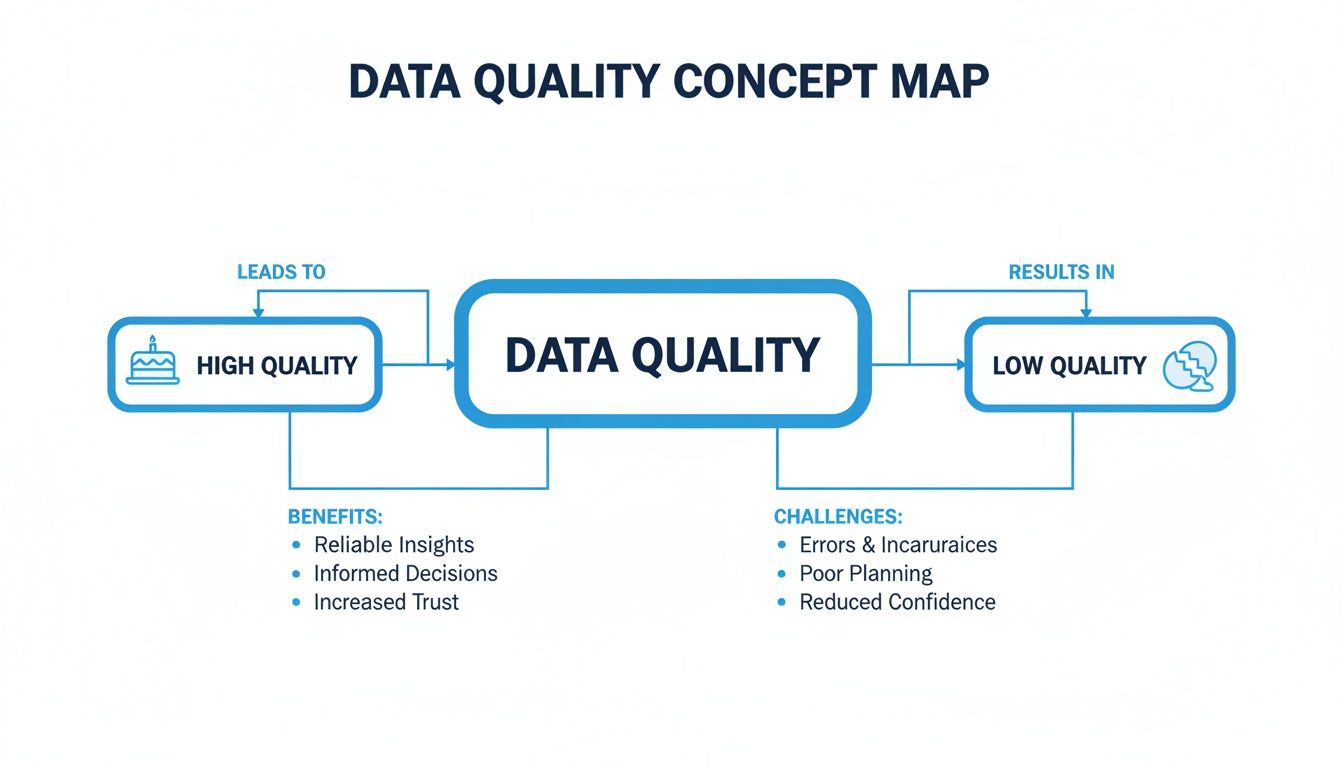
High-quality data is the solid foundation for every business decision. Low-quality data? That’s like building on quicksand.
Accuracy is the dimension everyone thinks of first: Is the data correct? It’s a measure of how well your information matches reality. In ecommerce, even a tiny inaccuracy can create massive ripple effects.
Imagine a product's weight is listed as 2 lbs when it’s actually 20 lbs. Your shipping cost calculations will be completely off. You’re left with a terrible choice: either eat the unexpected shipping fees and destroy your margin, or hit the customer with a surprise charge and destroy their trust.
Completeness asks a simple, powerful question: Do we have all the information we need? This is all about the gaps, the missing pieces of the puzzle that are silently killing sales and efficiency.
Think about a customer shopping for a new laptop. They want to filter by screen size, RAM, and processor. If half your listings are missing these key details, those products become invisible. You just lost a sale, not because you didn't have the right item, but because your data was incomplete.
In ecommerce, completeness isn't just a "nice-to-have." It's a requirement for visibility. Marketplaces like Amazon and Google Shopping have strict attribute requirements, and products with incomplete data are often suppressed or completely delisted.
Consistency means that the same piece of information is identical everywhere it appears. It’s about creating a single, reliable truth across all your systems, including your PIM, ERP, website, and marketplaces.
Inconsistencies are little bits of chaos that create confusion for everyone.
These small discrepancies break automated workflows, corrupt your analytics, and make your brand look amateurish. A centralized system like a PIM is your best defense for enforcing consistency.
Timeliness is all about how up-to-date your data is. Information has a shelf life, and for many operations, "recent" isn't good enough. You need it in real-time. The most critical example in retail is inventory.
When a customer buys the very last item in stock, that information needs to fly across all your sales channels instantly. A delay of just a few minutes can lead to selling the same item twice. The result is always the same: a canceled order, an operational headache, and a deeply frustrated customer.
Validity is about conforming to a specific format or a predefined set of rules. It ensures data isn't just there, but that it’s in the right shape. This is absolutely critical for technical and logistical data.
For example, a valid email must have an "@" symbol. A valid US phone number needs 10 digits. A valid product SKU might follow a strict pattern like "ABC-12345-XL". Invalid data causes system errors, breaks integrations, and makes importing or exporting data impossible.
Finally, uniqueness guarantees there are no duplicate records in your dataset. Duplicates are the enemy of clarity. They muddle your data and create absolute chaos in your systems.
Imagine having three different records for the same customer because they used slightly different email addresses. Which one has their most recent order? Which has the correct shipping address? In a product catalog, duplicate listings for the same item split customer reviews, confuse shoppers, and turn inventory management into a nightmare.
Eliminating duplicates is a foundational step in any data cleanup effort. This is becoming a bigger priority for businesses every year. In fact, a recent global study found that 64% of organizations now see data quality as their top challenge, a significant jump from just a few years ago. You can read the full research about these data quality findings and see for yourself how the landscape has shifted.

Understanding the six dimensions of data quality is one thing. Connecting them to your bank account is another. Bad data isn't just a tech problem or a minor headache. It's a silent profit killer that slowly drains your resources, frustrates your team, and chips away at your brand's reputation.
Think of it this way: your business is a high-performance engine, and data is its fuel. When you pour dirty, contaminated fuel into that engine, it sputters, stalls, and eventually breaks down. The same thing happens when your entire operation runs on messy, inaccurate, and inconsistent information.
The costs of poor data quality pop up in nearly every corner of an ecommerce business. They aren't always obvious, but their combined impact can be staggering. These hidden costs often disguise themselves as routine operational issues, but trace them back, and you'll almost always find bad data is the culprit.
Here’s where the pain is most acute:
These problems might seem small in isolation, but they add up to a significant financial bleed. Research shows just how severe the issue is. Poor data quality is costing companies dearly, with over 25% of global data and analytics teams estimating annual losses north of $5 million. For retailers and manufacturers, this hemorrhage hits hard when bad product data leads to stockouts, overstocks, and abandoned carts. You can discover more insights about these financial losses on forrester.com.
For brands selling on multiple marketplaces like Amazon, Walmart, and eBay, the costs multiply exponentially. Each platform has its own strict, non-negotiable rules for product data. A pricing error on your website is one problem. A pricing error that gets syndicated to all your channels can trigger mass delistings and even account suspensions.
Investing in data quality isn't an expense. It's a high-return investment in operational efficiency, customer satisfaction, and brand credibility. Fixing data at the source prevents costly problems from ever happening downstream.
Ultimately, cleaning up your data is about plugging the leaks in your revenue bucket. By ensuring your product information is accurate, complete, and consistent, you turn data from a liability into your most valuable asset. It builds a solid foundation for growth, allowing you to scale confidently without being dragged down by preventable, expensive errors.
You can't fix what you can't measure. For a long time, data quality felt like a vague, gut-feel problem. Businesses knew their information was messy, but they had no real way to quantify how messy it was. Without numbers, you can't track progress or justify investing in a solution.
Fortunately, that era of guesswork is over. You can, and should, measure the health of your product data just like any other business KPI. When you turn an abstract problem into concrete numbers, you finally get a real handle on the issue and can start making targeted improvements.
The shift is simple but powerful. Go from "our data feels incomplete" to "our product data has a completeness score of 72%." This gives your team a clear benchmark and a shared goal to rally around.
The best first step is a process called data profiling. Think of it like a diagnostic scan for your entire product catalog. It's an automated process where tools dig into your datasets to create a high-level summary of what’s really going on under the hood.
This process automatically uncovers hidden issues you'd probably never spot by hand.
Instead of guessing where the problems are, data profiling gives you an objective, data-driven report that pinpoints your biggest weaknesses. It’s your starting line.
With a baseline from data profiling, you can build a data quality scorecard. This is where you turn those quality dimensions into measurable metrics that everyone on your team can understand.
A data quality scorecard transforms abstract concepts into tangible KPIs. It might reveal that while your pricing data is 99% accurate, your technical specifications are only 65% complete. Suddenly, you know exactly where to focus your efforts. The conversation shifts from "we need better data" to "our goal is to lift the spec completeness score to 90% this quarter."
This dashboard from a modern PIM system shows exactly how these scores get visualized.
Here, you can see at-a-glance metrics like completeness percentages and data validation status, giving teams a live view of their data's health. This kind of visual feedback makes it easy to spot which product categories or channels need immediate attention.
Your scorecard should be built around what matters most to your business. For most online retailers, this means creating metrics that map back to the six dimensions of data quality. Below is a simple table to give you some practical ideas to get started.
By tracking these kinds of numbers, you can finally manage what you measure. Your team can set clear goals, celebrate wins, and prove the value of your data quality initiatives with hard data.
Knowing your data is a mess is one thing. Actually building a system to fix it is a completely different ballgame. So, are you ready to get your hands dirty? Here’s a practical game plan for taking control of your data quality.
The goal is to shift from constantly putting out fires to preventing them in the first place. We want to stop bad data before it ever has a chance to wreak havoc on your business.
This all starts with creating a data governance framework. Don’t let the term scare you. It’s really just about setting clear rules for your data, defining who owns what, and getting your entire team to speak the same language. A solid framework is your roadmap from data chaos to data clarity.
The very first step in any successful data project is to make sure everyone is on the same page. A data dictionary is your central playbook, a simple document that defines what each piece of data means and what the rules are for using it. It’s the key to eliminating ambiguity and ensuring consistency.
Your data dictionary doesn’t have to be some overly complex technical document. Honestly, a simple spreadsheet can work wonders.
This simple tool is what prevents one team from calling a color "Navy Blue" while another calls it "Midnight." It establishes a single source of truth for your data definitions, once and for all.
If a data dictionary sets the standard, then validation rules are what enforce it. These are automated checks that stop bad data from ever entering your systems. Think of them as a bouncer at the door of your database, turning away any information that doesn't meet the entry requirements.
Setting up validation rules is a foundational part of data governance. It’s the most effective way to improve data quality because it stops problems at the source, rather than trying to clean up messes after the fact.
For example, you can set rules that:
This proactive approach is far more efficient than constantly running painful cleanup projects. The growing demand for this kind of automation is clear. The global Data Quality Management Service Market is projected to explode from $1.8 billion in 2023 to $5.9 billion by 2032, driven by the urgent need for tools that automate data cleansing and profiling. You can read the full research about this market growth on dataintelo.com.
Trying to manage product data across dozens of spreadsheets and disconnected systems is a recipe for disaster. A Product Information Management (PIM) system acts as the central command center for all your product data. It becomes the single source of truth where your data dictionary and validation rules actually live and breathe.
For teams looking to wrangle their data, understanding the harmonization of data is key to building a unified, coherent strategy.
A critical part of any practical framework for fixing data involves using the best data enrichment tools to boost the completeness and accuracy of your information. When you centralize data in a PIM, you can use these tools much more effectively to fill in gaps and fix errors across your entire catalog from one place. This makes it infinitely easier to enforce consistency across all your sales channels, from your own website to Amazon and beyond.
A PIM system helps you:

As we look ahead, the conversation around data quality is becoming inseparable from the rise of artificial intelligence. It's a common mistake to see AI as a magic wand that can instantly fix years of messy, disorganized data. The reality is the exact opposite.
High-quality data is the essential fuel that makes AI smart. Without it, even the most powerful algorithms are useless. An AI model trained on incomplete, inaccurate, or inconsistent information will only produce flawed results, just faster and at a much greater scale. It's the ultimate "garbage in, garbage out" scenario.
But the story doesn't end there. While AI absolutely depends on good data, it's also becoming our most powerful tool for creating it. The relationship is circular: better data leads to smarter AI, and smarter AI helps us achieve even better data.
For years, tasks like data cleansing, enrichment, and categorization were manual, mind-numbing chores. Teams would spend endless hours poring over spreadsheets, correcting typos, and trying to standardize formats. This approach was slow, expensive, and riddled with human error.
Today, AI and Large Language Models (LLMs) are completely changing the game. These technologies can automate data quality tasks at a scale and speed that humans simply cannot match. AI can instantly analyze millions of records, spot patterns, and make corrections based on the rules you set.
Imagine a common problem for online retailers. You get product data from a new supplier in a messy, unstructured spreadsheet. The titles are all over the place, key specs are missing, and the descriptions are poorly written.
In the past, this meant days of manual data entry. Now, an AI-powered system can ingest that chaotic spreadsheet and, in minutes, transform it into perfectly structured, channel-ready content for marketplaces like Amazon or Google.
This shift moves your team away from tedious "data janitor" work and toward more strategic roles. Instead of manually fixing errors, they can focus on setting the rules and overseeing the AI, ensuring the automated outputs align with your business goals. You can learn more about how AI is reshaping this kind of work in our guide on AI in digital asset management.
Here's the biggest takeaway. Investing in your data quality today is the single most important step you can take to prepare for an AI-driven future. The next wave of online search and shopping will be powered by AI assistants and generative search engines. These tools rely on structured, high-quality product data to answer customer questions directly.
If a customer asks an AI, "Find me a waterproof hiking boot under $150 with excellent ankle support," the AI will scan for products that have that specific data, correctly formatted and categorized. If your product information is incomplete or locked away in a PDF, your products will be invisible.
Preparing for this shift means making sure your data is:
Ultimately, your product data is no longer just for human eyes on a webpage. It's becoming a direct line of communication with the AI systems that will guide future customers. Building a strong data quality foundation now ensures your products will be ready and discoverable in this new era of commerce.
We get it. The world of data quality can feel a bit abstract. Here are some quick, straightforward answers to the questions we hear most often.
Measurement. Always start with measurement. You can't fix what you can't see.
The best way to begin is with a data quality assessment, sometimes called data profiling. This process gives you a clear snapshot of your data's health, highlighting the biggest problem areas, like missing product descriptions or incorrect pricing. From there, you can prioritize what to fix first instead of trying to boil the ocean.
Not quite. Think of AI as an incredibly powerful and tireless assistant, not a miracle worker. AI can automate cleaning, flag errors, and even enrich your data at a scale humans could never match. But it needs good rules and human oversight to do its job well.
It's the classic 'garbage in, garbage out' scenario. AI thrives on high-quality data. It can't magically create order from total chaos without a solid data governance strategy guiding it.
Technologies like Large Language Models (LLMs) are at the core of these new automation capabilities. Understanding how they work clarifies what AI can, and can't, do for you. They still need clear instructions to perform correctly.
Data quality isn't a one-and-done project. It's a continuous process, like weeding a garden. How often you check depends entirely on how critical the data is.
For mission-critical information like inventory levels or pricing, you need real-time or near-real-time monitoring. For less dynamic attributes, weekly or even monthly checks might be fine. The goal is to make data quality monitoring a continuous part of your day-to-day operations so small issues don't snowball into massive headaches.
Ready to stop fighting fires and start preventing them? NanoPIM centralizes your product information, automates quality checks, and uses AI to enrich your catalog for the modern era of search. See how you can build a reliable foundation for your data at https://nanopim.com.


