
Managing data quality isn’t just some technical busywork. It's about protecting your bottom line by making sure the information your customers see is accurate, complete, and trustworthy. In short, it’s the process of making sure your data is fit for its purpose, a factor that directly impacts sales, customer loyalty, and operational sanity.

Let's get real for a moment. Poor product data is actively costing you sales and frustrating your customers. This isn't a theory. It's the daily reality for any eCommerce manager juggling constant supplier updates and the demanding, ever-changing requirements of multiple sales channels.
Imagine a customer is ready to buy a bookshelf, but the product page is missing the dimensions. They can't be sure it will fit, so they leave and buy from a competitor who provided that crucial detail. This exact scenario plays out thousands of times a day. In fact, multiple studies show that businesses can lose up to 30% of online sales due to incomplete or inaccurate product information.
For years, spreadsheets were the default tool for managing product information. While they seem simple enough, they quickly become a massive bottleneck as your business grows. The truth is, they just can't keep up with modern commerce. To really feel the urgency, just look at the shockingly high manual data entry error rates and how they cripple business efficiency.
A single copy-paste mistake can send the wrong color code to your Shopify store, leading to an unhappy customer and a costly return. Or, a product manager might forget to add a key attribute for an Amazon listing, causing it to get suppressed from search results and killing its sales potential overnight.
The core issue is that spreadsheets are disconnected and riddled with potential for human error. When your data is scattered across different files, departments, and employee desktops, keeping anything consistent is a nightmare.
This is where proactive data quality management comes in. It’s about shifting from a reactive "fix-it-when-it-breaks" mindset to building a system that prevents bad data from ever reaching your customers in the first place. You can learn more about the fundamentals in our guide on what is data quality.
Poor data isn't just an abstract problem for the IT department; it creates very real financial and reputational damage. We're talking about tangible costs that show up on your profit and loss sheet.
The table below breaks down exactly how common data issues translate into business pain.
| The Real Cost of Poor Data Quality |
| :--- | :--- | :--- |
| Data Quality Problem | Direct Impact on Business | How It Hurts Your Brand |
| Missing dimensions or specs | Cart abandonment, lost sales | Customers see you as unprofessional or lazy. |
| Incorrect product images | Higher return rates, restocking costs | Creates a major trust gap; they received something they didn't order. |
| Inconsistent pricing across channels | Customer support tickets, lost trust | Looks like you're trying to trick them; erodes confidence in your pricing. |
| Incomplete product descriptions | Lower conversion rates, poor SEO | Your products don't get found, and when they do, shoppers lack confidence to buy. |
| Typos and grammatical errors | Damaged brand perception | Makes your entire operation look sloppy and untrustworthy. |
Each of these issues chips away at your brand's credibility and profitability.
Ultimately, turning data quality from a background chore into a core business strategy is essential for survival and growth. It's the foundation upon which great customer experiences, efficient operations, and profitable sales channels are built.
After seeing the real costs of bad data, it’s easy to feel a bit overwhelmed. But bringing order to the chaos doesn't have to be some massive, complicated project. Building a solid framework to manage your data quality is really about taking small, smart steps. You’re laying a foundation.
Think of it like building a house. You wouldn't just start throwing up walls randomly, right? You'd start with a blueprint, defining what you need, where it goes, and who is responsible for what. A data quality framework does the exact same thing for your product information.
Before you can fix anything, you have to know what you're working with. This means doing a quick health check on your existing data. Don’t try to boil the ocean. Instead, zero in on the data that has the biggest impact on your business.
A great place to start is by pinpointing the critical data elements that make or break a sale. For an online furniture store, this might be dimensions, material, and assembly instructions. For a fashion brand, it’s probably size charts, fabric composition, and care instructions.
This simple exercise will give you a clear, honest picture of your biggest data gaps. You'll quickly see patterns, like consistently missing images or incomplete technical specs, which tells you exactly where to focus your efforts first.
Once you know where the problems are, you can set clear goals for what "good" actually looks like. Vague goals like "improve data quality" are useless. You need specific, measurable targets that your team can actually work toward.
Think in terms of tangible outcomes. For instance, instead of a generic goal, you could set targets like:
These kinds of goals turn an abstract concept into a concrete action plan. They give your team a finish line to aim for and make it easy to track progress and celebrate wins along the way.
Surprisingly, a lot of companies skip this foundational step. Research shows that 37% of organizations still lack a formal data quality management program, which leads to major inefficiencies. This gap is a huge problem, with some estimates suggesting that 10-25% of marketing budgets are wasted due to bad data. To understand more about the future of product information, you can find more details in this in-depth analysis on product information management.
"Data governance" sounds corporate and intimidating, but it's really just about answering one simple question: who is responsible for what? Without clear ownership, data quality quickly becomes a hot potato that everyone tries to pass off. You need to establish straightforward rules and assign clear roles.
This doesn't require some complex organizational chart. Just start by defining accountability for key data domains. For example:
When building your own data quality framework, it can be helpful to review existing concepts and best practices, such as those discussed in dedicated resources on Data Quality Frameworks. Clarifying these roles ensures that accountability is baked into your process from day one. You can learn more about how this fits into a larger strategy by reading our guide on master data management solutions.
With your data quality framework in place, it’s time to get practical and map out the actual journey your product data will take. This is where the magic really happens, transforming messy, raw supplier files into a valuable asset.
A modern data management workflow isn’t some rigid, one-way street. It's a dynamic, intelligent system built to catch errors, enrich information, and ensure only the best data ever makes it to your customers. The goal is to create a process that's both efficient and foolproof.
First things first: you need a safe space to handle incoming information without risking your live catalog.
Think of a staging area as a quarantine zone for your data. When a supplier sends you a new spreadsheet with thousands of product updates, the absolute last thing you want to do is dump it directly into your live system. That’s a recipe for disaster, instantly polluting your clean product catalog with potential errors, duplicates, and incomplete entries.
Instead, all incoming data, whether from a supplier spreadsheet or an API feed, should land in this isolated staging environment first. Here, it can be inspected, cleaned, and standardized without ever touching what your customers see.
This approach gives you a critical buffer. It lets you compare the new data against your existing information, identify major gaps, and decide what to accept, reject, or fix before it gets anywhere near your main database.
The single biggest mistake growing brands make is mixing raw supplier data with their polished, customer-facing information. A staging area is your first and most important line of defense.
Once your data is safely in the staging area, the real power of a modern workflow kicks in. This is where automation takes over the soul-crushing manual work that used to consume countless hours. It’s all about automatically checking data against your rules and then making it better.
Here’s how this two-part process typically works:
Imagine turning a supplier's raw data file into perfectly structured copy for both your Google Shopping feed and your Amazon A+ Content, all in a matter of minutes. That’s the kind of efficiency we're talking about.
This process builds on the foundational steps of assessment, definition, and governance that make a reliable workflow possible.
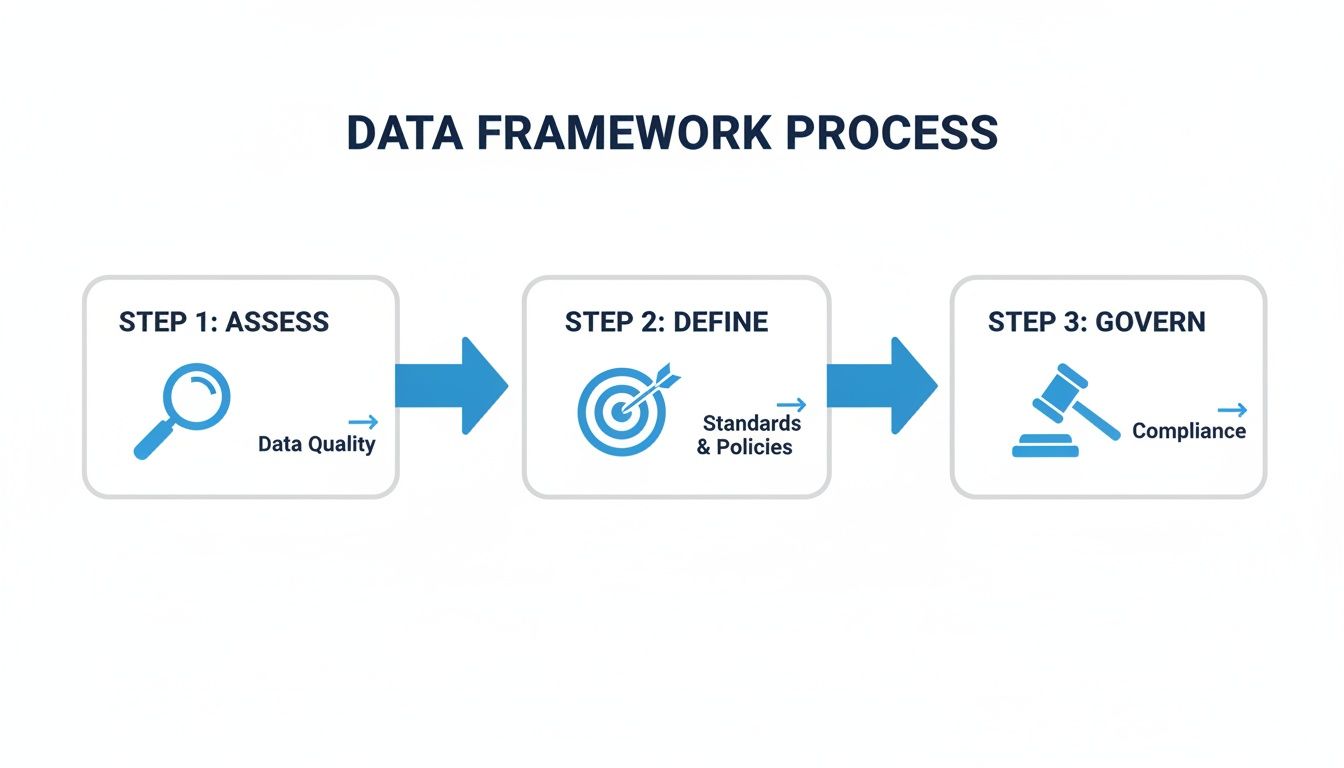
As the graphic shows, a successful workflow turns your strategic goals into operational, repeatable steps.
Automation is a game-changer, but it shouldn't operate in a black box. The most effective workflows always incorporate a "human in the loop" for review. This approach blends the speed of AI with the irreplaceable expertise and intuition of your team.
This is often managed through automated scoring. Based on your rules, every product is assigned a data quality score. A product with all required attributes, high-resolution images, and a detailed description might score a 95%. But one missing its material information might only score 60%.
From there, you can set up simple rules based on these scores:
For a real-world example, an apparel brand could set up a workflow that ensures all new clothing items have material composition and care instructions. The system would automatically flag any new shirt or pair of jeans missing this information, holding it back from going live until a product manager adds the required details. This simple check prevents customer complaints and costly returns down the line.
This hybrid approach gives you the scale of automation with the confidence of human oversight, the true cornerstone of managing data quality today.
Let's be honest. Manually checking thousands of SKUs for data quality is a losing battle. It's a never-ending cycle: by the time you've finished checking one batch, another one lands on your desk. This is where you graduate from one-off fixes to building a system that guards your data quality 24/7.
We're shifting from reactive spot-checking to proactive, automated oversight. The goal is to stop putting out fires and start preventing them from ever sparking.
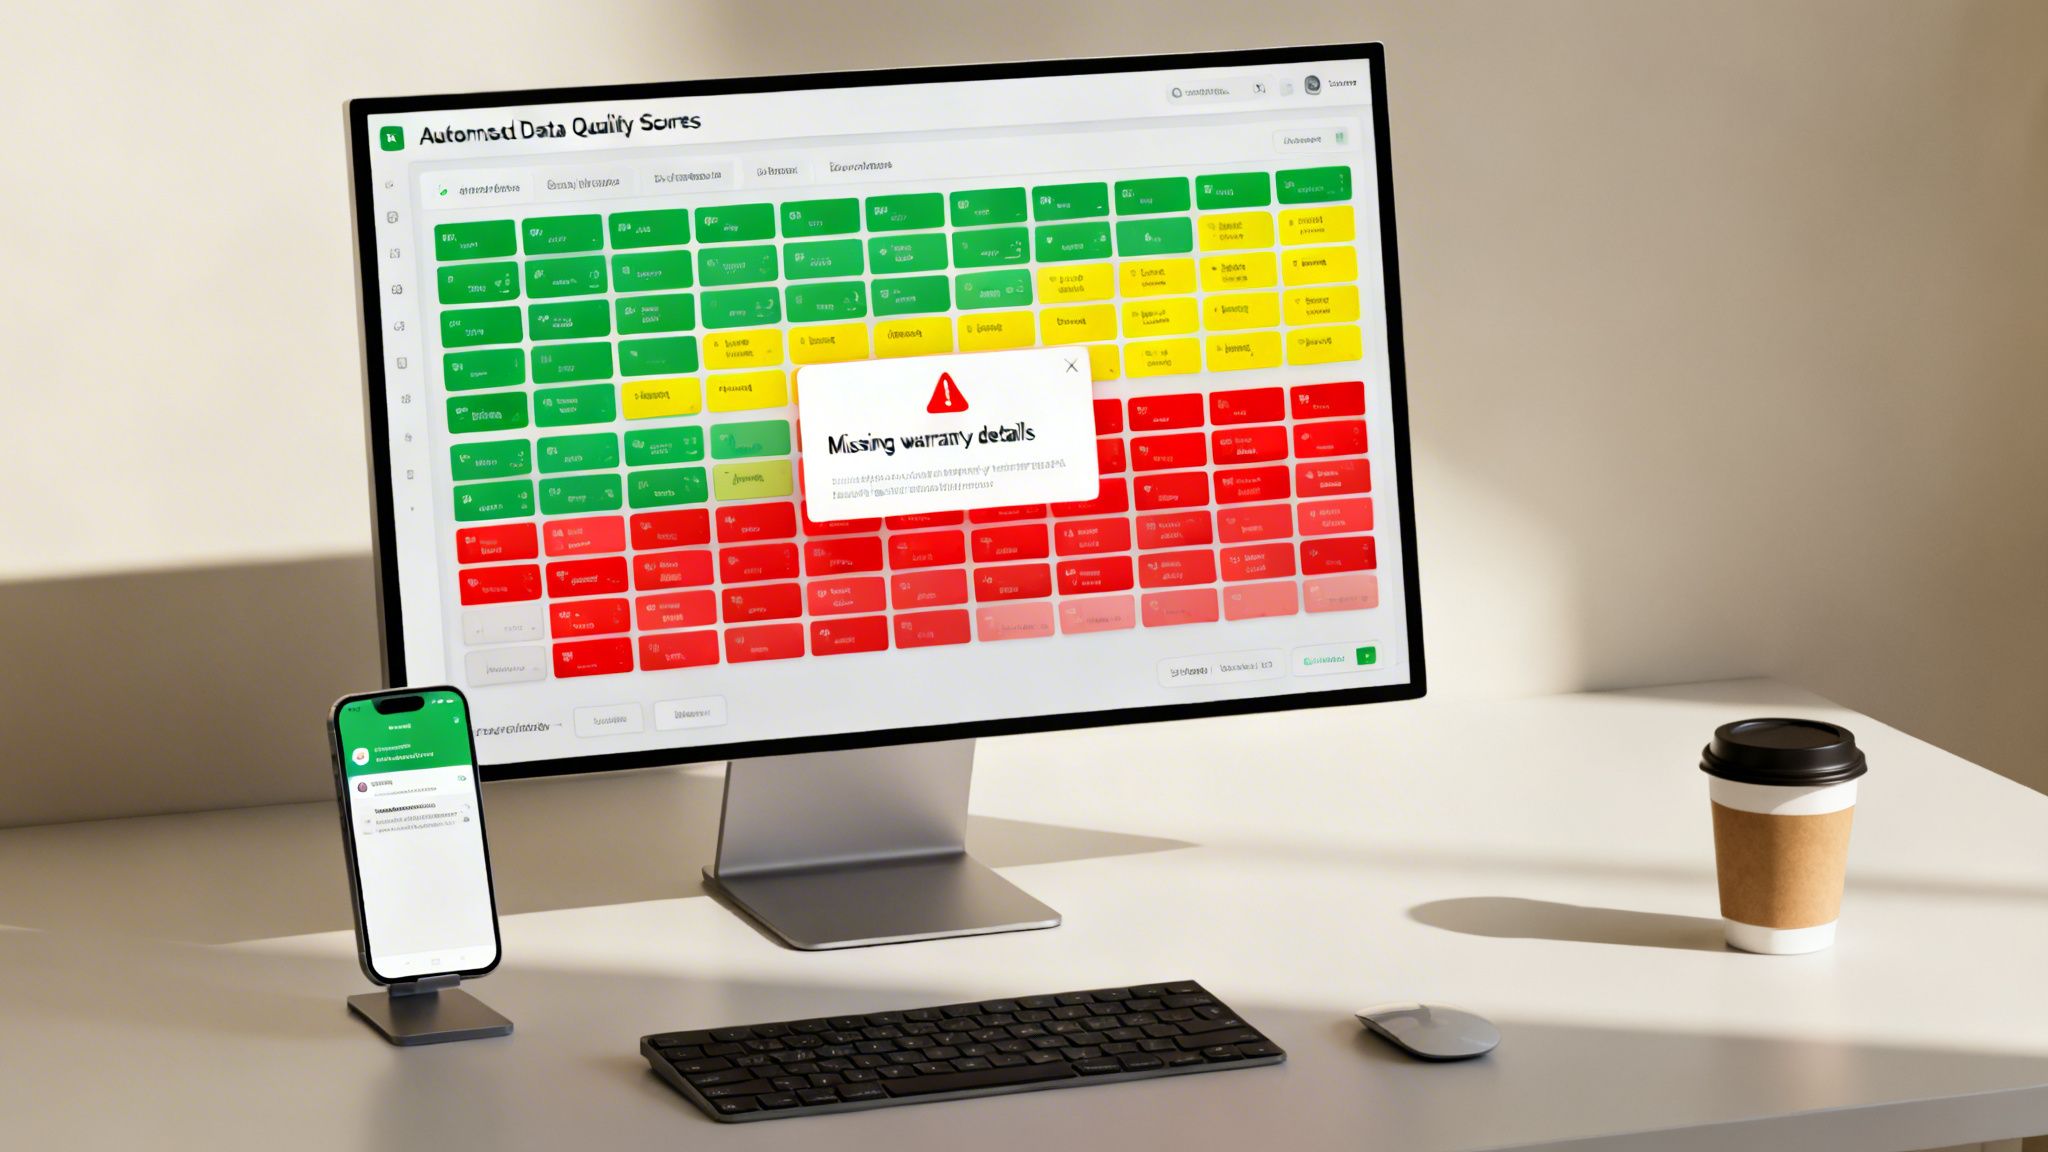
The engine of any good automated system is data scoring. This means your system automatically assigns a "health score" to every product in your catalog based on the rules you’ve defined. It’s a simple, at-a-glance way to gauge the quality and completeness of each item.
Think of it like a report card for your products, graded on a few key dimensions:
This scoring runs continuously in the background, giving you a real-time pulse on your catalog’s health without you having to lift a finger.
Standard checks for empty fields are table stakes. The real magic happens when you create custom business rules tailored to your specific products and customers. This is your secret weapon for exceptional data quality.
For example, an electronics retailer could set a rule to automatically flag any product over $200 that’s missing warranty information. Why? Because they know from experience that for high-ticket items, a missing warranty is a major friction point that kills conversions.
Your best business rules will come directly from your customer service logs and return reasons. What information, when missing, causes a shopper to call, email, or abandon their cart? Turn that into a rule.
Here are a few more real-world examples you could build:
These rules essentially turn your team’s hard-won expertise into an automated process, ensuring your unique quality standards are met across the board.
A score is just a number until it triggers an action. The final piece is setting up smart alerts that notify the right person at the right time. The goal is to find out about a data problem from your system, not from an angry customer email.
Blanket alerts are useless. Sending every notification to a general inbox is the fastest way to get them all ignored. Instead, you need to route alerts based on the error type and who owns the fix.
For instance:
This targeted approach creates clear accountability and drastically cuts down resolution time. A modern dashboard gives you a command center view of your entire catalog's health, turning what was once reactive chaos into proactive, organized management.
Your product data isn't meant to live in a silo. It’s the lifeblood of your entire operation, flowing from your internal systems out to every customer touchpoint. To truly master your data quality, your Product Information Management (PIM) system needs to be the central heart, pumping clean, consistent data to every other platform in your stack.
A PIM on an island is just a fancy database. Its real power is only unlocked when it’s deeply connected to your business-critical systems. This means forging strong, two-way integrations that establish a single source of truth everyone can rely on.
When your PIM is properly plugged into your key platforms, the magic happens. A solid integration strategy means that when you update a price, add a new hero image, or tweak a product description in one central place, it reflects accurately everywhere. The days of manual updates across a dozen different logins are over.
This synchronization is essential for maintaining consistency and clawing back countless hours of wasted effort. The most crucial integrations usually include:
The rise of omnichannel retail has put immense pressure on teams to deliver perfect content, everywhere, all the time. It’s a major reason the PIM market is set to explode, projected to surge from $4.47 billion in 2024 to $20.66 billion by 2032. As these data management trend insights show, this growth is a direct response to the urgent need for a central hub to manage the chaos.
Integration isn't just about pushing data out. The most strategic setups create a feedback loop where performance data from your sales channels flows back into your PIM. This is where data management stops being a simple chore and starts being a powerful growth engine.
By linking sales data back to your product information, you can finally answer critical business questions with hard evidence.
You stop guessing what works and start knowing. This feedback loop connects your data quality efforts directly to your bottom line, showing you exactly what moves the needle.
For instance, you can start analyzing metrics like conversion rates, return data, and customer reviews right alongside the product data itself.
Let’s walk through a real-world example. Imagine your team just spent a week shooting and adding new lifestyle photos for your latest furniture line.
The same logic applies to returns. If you notice a specific product has a high return rate with customers citing "wrong color," you can immediately pull up that product's data in the PIM. Maybe the images are poorly lit or the color description is too vague. This feedback lets you fix the root cause, not just deal with the symptom.
This approach transforms your PIM from a simple database into a strategic intelligence tool. You can dive deeper into this concept in our guide on product information management. It makes managing data quality a proactive, continuous cycle of improvement that directly fuels business growth.
Getting started with data quality management can feel a bit daunting. You know it's important, but where do you even begin? We get it. People often come to us with a handful of great questions, so I've put together some straightforward answers to the ones we hear most often.
The best way to start is with a small, focused audit. Forget trying to boil the ocean and analyze everything at once, that’s a guaranteed recipe for getting overwhelmed.
Instead, pick a manageable slice of your catalog. Maybe it's one of your most important product categories or your top 20% best-selling items. Now, create a simple checklist of what "good" looks like for these products. For example, a complete product might need:
Then, just go through your chosen products one by one and check them against your list. This mini-audit will immediately show you the most common problems, like maybe you're consistently missing material information or using ancient, low-res images. It gives you a tangible, non-intimidating starting point without kicking off a massive, complicated project.
Speak their language: money. Your leadership team needs to see a clear return on investment. Don't talk about "data cleanliness"; frame the discussion around business outcomes and the financial impact of doing nothing.
Use industry stats to make them lean in, like how poor data quality can slash online sales by up to 30%. But the real power comes from your own data. Start tracking return rates and connect them directly to missing or inaccurate product information.
Imagine walking into a meeting and saying this:
"We processed 50 returns last month for 'wrong size' on our new shoe line. I checked, and that product page has no sizing chart. Those returns cost us thousands in shipping and restocking."
When you present it this way, you’re not asking for an expense. You’re presenting a solution to stop losing money and start increasing conversions. The investment in a proper data quality tool becomes a clear path to better profitability.
Not quite. Think of AI as an incredibly powerful assistant, not a replacement for your team's expertise. The sweet spot is a "human-in-the-loop" system where your people and the tech work together.
Let AI do all the heavy lifting and grunt work. It's brilliant for things like:
Then, your human experts step in to review, tweak, and give the final seal of approval. For instance, some platforms use AI to score content and can automatically flag any product with a score below 80%, sending it to a product manager for a final look. This gives you the incredible scale of automation but with the confidence that only comes from human oversight.
Ah, the classic problem for any growing business. The solution is a one-two punch of process and technology. You have to stop bad data before it gets into your system.
First, create a crystal-clear "Supplier Data Requirements" document. This is your rulebook. It should spell out the exact formats, required fields, and image specs for any data you accept. This becomes a non-negotiable part of your supplier onboarding.
Second, use a PIM that has a dedicated staging area or "data holding bay." When a supplier sends you a new product file, you don't import it directly into your live catalog. You put it in this safe, isolated environment first. The system can then automatically run validation rules against it and spit out a report showing exactly what's missing or formatted incorrectly.
You can then fire that clear, actionable report right back to the supplier for them to fix. This process doesn't just block bad data; over time, it trains your suppliers to get it right the first time.
Ready to stop fighting data fires and build a system for lasting quality? NanoPIM gives you the AI-powered tools, automated scoring, and human-in-the-loop workflows to turn your product data into a competitive advantage. See how you can centralize, enrich, and syndicate your information with confidence at https://nanopim.com.


