
A data quality framework is, at its heart, a comprehensive plan. It lays out the standards, processes, roles, and tools your company will use to manage and maintain high-quality data. It’s the official rulebook for keeping your information accurate, complete, and trustworthy.
Think of it as the blueprint for building a reliable data house. Without it, you’re just guessing.
Imagine trying to build a house with no blueprints. The foundation might be crooked, the walls might not line up, and the roof is almost guaranteed to leak. This is exactly what happens when businesses operate without a data quality framework. They’re building their most important assets like strategies, marketing campaigns, and customer experiences on a shaky foundation of "bad data."
And this isn't a small problem. Poor data quality is one of the single biggest challenges for organizations today. In fact, new research shows 64% of businesses identify it as their top data integrity issue.
This has real, painful consequences. Companies struggling with subpar data see 60% higher project failure rates. A solid framework is what moves you from a reactive state of constantly fixing errors to a proactive one where quality is built-in from the very beginning.
Before you can build a framework, you need to know what "good data" actually means. It all comes down to six core dimensions. These are the pillars that hold up your entire data strategy.
| Dimension | What It Measures |
|---|---|
| Accuracy | Does the data reflect the real world? Is a customer's address correct? |
| Completeness | Are all the required data fields filled in? Is anything missing? |
| Consistency | Is the data the same across all your different systems and databases? |
| Timeliness | Is the data available when you need it? Is it up-to-date? |
| Uniqueness | Are there duplicate records cluttering your system (e.g., two profiles for one customer)? |
| Validity | Does the data conform to the rules? (e.g., Is an email in a valid format?) |
Getting a handle on these six dimensions is the first step toward building a system that produces data you can actually rely on.
Without a formal plan, data quality becomes a chaotic and frustrating game of whack-a-mole. One team fixes a product SKU in one system, only to watch it get overwritten by bad data from another. A marketing campaign targets the wrong audience because customer information is five years out of date.
A solid data quality framework stops this chaos by establishing:
Think of it this way: a data quality framework is your company's constitution for information. It lays down the laws, establishes the branches of government (your data governance team), and provides the system for enforcing those laws.
Ultimately, a data quality framework isn't just some technical exercise for your IT department. It’s a fundamental business strategy that directly impacts your bottom line. Trustworthy data leads to smarter decisions, more effective marketing, and genuinely happier customers. You can learn more about its core principles in our guide on what is data quality.
By creating a system to manage your data's health, you stop wasting time, money, and resources on fixing preventable mistakes. Instead, you build a reliable asset that fuels growth, innovation, and a serious competitive edge.
To build a data quality framework that actually works, you have to know what you’re measuring. This is where the six dimensions of data quality come in.
Think of them as six different lenses for inspecting your information. Each one helps you grade your data’s health, turning the vague idea of "good data" into something you can actually track and fix.
When you bring them all together, you get a complete picture of your data's reliability. The goal is to move from abstract concepts to concrete metrics you can manage. This diagram shows how these dimensions fit into a broader framework of rules, roles, and tools.
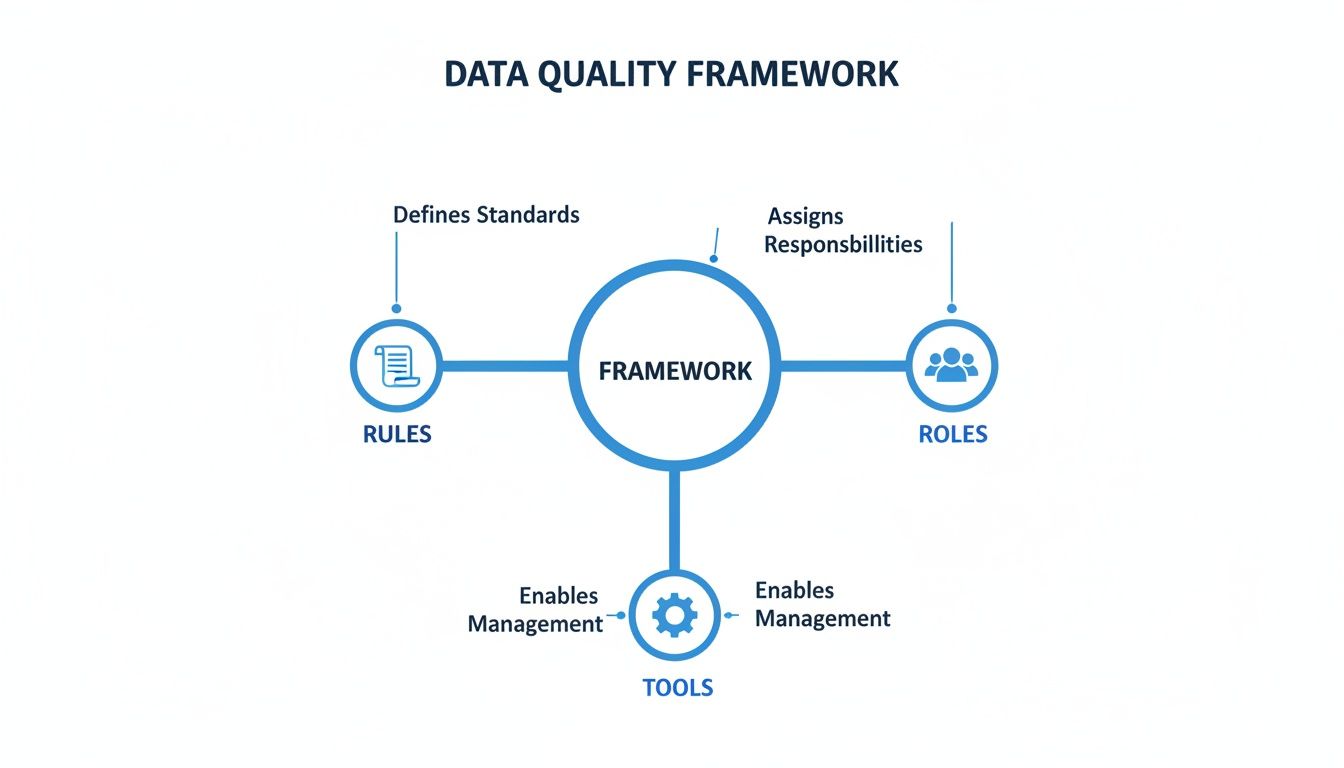
As you can see, a solid framework isn't just about software. It’s a complete system where clear rules guide the right people, who are then empowered by the right tools to get the job done.
Accuracy answers a simple question: Does our data match the real world? It’s the most basic dimension, but it's also where some of the most costly mistakes happen. When data is inaccurate, it directly misleads your team, your systems, and your customers.
For an ecommerce store, this could be:
These errors create immediate financial pain and frustrate customers. A PIM like NanoPIM attacks this problem by centralizing information. When you update a price or spec in one place, that change populates accurately across every channel, killing the risk of conflicting information.
Completeness asks a critical question for any seller: Is all the necessary information there? Incomplete data is a silent conversion killer. It creates a poor customer experience and can even get your products suppressed on marketplaces like Amazon or Google Shopping.
Imagine a customer looking for a new laptop. If your product page is missing key details like RAM, storage capacity, or screen resolution, they aren't going to guess. They'll just leave and buy from a competitor who gives them the full story.
A data quality framework ensures you define what "complete" means for each product. A t-shirt might just need size, color, and material, but a television needs dozens of technical specs to be considered complete.
NanoPIM tackles this head-on with completeness tracking. You can set up rules for each category, and the system automatically flags any product missing a critical attribute. This turns a manual guessing game into an automated alert, making sure your listings are always rich and ready to sell.
Consistency is all about a simple idea: Is our data the same everywhere it appears? When data is inconsistent, it erodes trust and creates confusion, both for your internal teams and your customers.
Common consistency mistakes look like this:
These might feel like small details, but they add up fast, making your brand look unprofessional. NanoPIM acts as the single source of truth, ensuring that every piece of data from brand names to attribute values is standardized before it gets sent to any sales channel.
Timeliness answers the all-important question: Is my data available when I need it? Data that shows up late is often completely useless. This dimension is all about the speed and relevance of your information.
For example, if your inventory data only syncs once a day, you’ll inevitably sell products that are already out of stock. This leads to canceled orders, angry customers, and a flood of negative reviews. Likewise, you can't launch a new product if the information isn't approved and ready on schedule.
A modern data quality framework demands tools that can handle updates in near real-time. By integrating your systems with a PIM, you ensure that inventory levels, price changes, and new product data are synced across all channels in minutes, not hours or days.
This dimension is all about eliminating clutter. Uniqueness asks: Do we have duplicate records? Duplicates create waste, cause confusion, and split valuable information across multiple, competing entries.
Having three different records for the same supplier, or two identical product listings with different SKUs, is a classic uniqueness problem. It makes reporting a nightmare and can lead to expensive mistakes, like ordering the same inventory twice.
NanoPIM's Data Holding Bay helps prevent this at the source. When new data is imported, the system can flag potential duplicates before they ever pollute your main catalog. This gives you the chance to merge or reject them, keeping your database clean and efficient.
Finally, validity is about making sure your data follows the rules. It asks: Is the data in the correct format? While it sounds like accuracy, validity is about structure, not truthfulness. A date like "February 30, 2026" is invalid simply because that day doesn't exist, even if it’s in a date-like format.
Other examples of invalid data include:
Setting up validation rules is a core function of any data quality framework. In NanoPIM, you can define the required format for each attribute. This forces all data entering the system to meet your standards from the very beginning, stopping bad data before it starts.
A data quality framework is only as strong as the people behind it. You can have the best rules and the slickest tools, but it’s the human element that truly turns a plan into a functioning system. This is what data governance is all about: putting a team in place that takes real ownership of your company's data.
Think of it like building a championship sports team. You need players in specific positions who know the playbook, understand their responsibilities, and work together to win. Without clear roles, data quality becomes a free-for-all where everyone assumes someone else is handling it.
When you establish this team, you build trust between your technical experts and your business users. People know exactly who to go to with a question, and those people have the authority to maintain the data. Confidence in your information skyrockets.
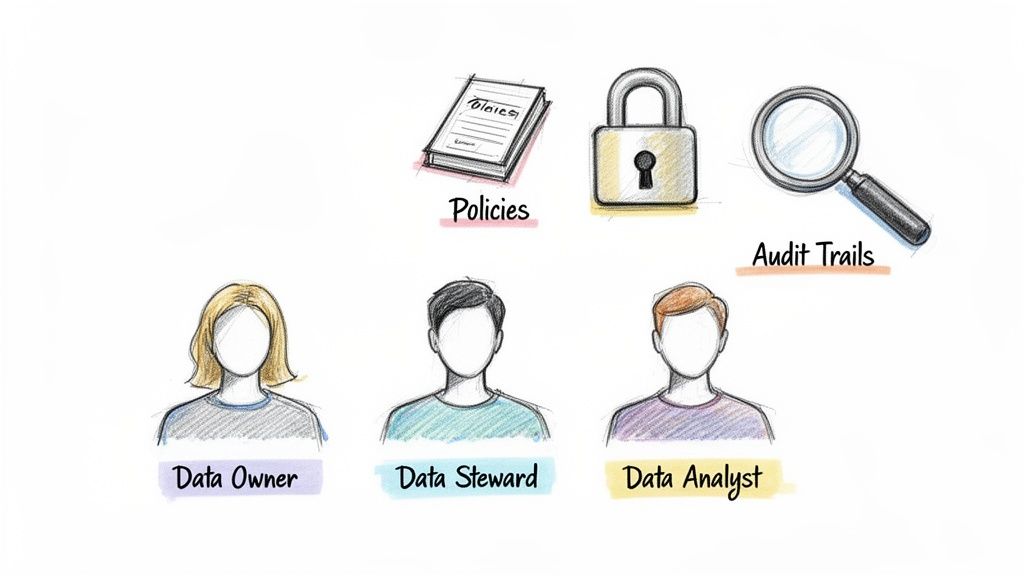
Every organization’s needs are a bit different, but a solid data governance team almost always includes a few key roles. These positions are the backbone of accountability in your data quality framework.
Data Owner: This is a senior leader, often a department head like the VP of Marketing or Head of Product. They aren’t managing data day-to-day, but they are ultimately accountable for the quality of data in their domain (like all customer data or all product data). They hold the authority to approve policies and secure resources.
Data Steward: These are your hands-on subject matter experts. A Data Steward is responsible for the tactical, daily management of a specific data set. For example, the steward for your ‘electronics’ category makes sure every new gadget has complete and correct specs. They are the go-to person for defining rules and fixing problems for their data.
Data Custodian: This role usually falls to someone in IT. They are responsible for the technical environment where the data lives, which includes the databases, security, and systems. They ensure the infrastructure is sound, but they don't define the business rules for the data itself.
Building this team is all about aligning people, processes, and technology toward a common goal. It’s a discipline that shares a lot of DNA with Marketing Operations, where structure and clear accountability are everything.
Once you have your team, they need a playbook. This is where data policies come in. These are the formal documents that outline the standards, rules, and procedures for managing data, turning your framework’s high-level goals into clear, actionable instructions.
These policies are the official rulebook. They aren't just helpful suggestions; they are the agreed-upon standards that everyone in the company must follow.
A good data policy answers the tough questions: What exactly makes a product record "complete"? Who has the authority to approve a new product description? How often do we need to review data for accuracy?
Clear policies eliminate confusion and empower your Data Stewards to enforce quality standards with confidence. For a deeper dive, check out our guide on creating data governance policies.
Modern tools are built to support and automate the work of a data governance team. A PIM system like NanoPIM provides the guardrails that make enforcing policies practical, not painful. It makes accountability easy.
For example, you can use built-in features to bring your governance structure to life:
User Roles and Permissions: You can give each user specific permissions. A Data Steward for apparel can get editing rights only for that category, while a Data Owner can have final approval rights over the entire catalog.
Audit Trails: This feature creates an unchangeable log of who did what and when. If an incorrect price goes live, you can instantly see which user made the change and what the previous value was. This level of accountability is essential for building a healthy data culture.
Approval Workflows: With NanoPIM, you can set up multi-step approval processes. A junior merchandiser might propose a change, but it won't go live until their designated Data Steward reviews and signs off on it.
These features empower your team to actually execute the data quality framework. They provide the visibility and control needed to make sure everyone plays by the rules, turning your governance plan into a daily reality.
So, you’ve put in the work. You’ve assembled your governance team and hammered out the rules. But how do you actually know if it’s paying off? After all, you can’t fix what you don’t measure. This is where you have to get serious about tracking your progress.
Don’t let the idea of "metrics" intimidate you. The goal is simple: turn abstract concepts like "accuracy" and "completeness" into cold, hard numbers. It’s about getting a straight answer to the question, "Is our data getting better, or are we just spinning our wheels?"
The demand for real answers has fueled an explosion in the tools designed to provide them. The global market for data quality tools is on track to hit USD 7.39 billion by 2031, rocketing ahead at a 17.7% compound annual growth rate. This isn't just hype; it's a direct response to the rise of AI and tougher regulations, showing just how essential solid measurement has become.
Key Performance Indicators, or KPIs, are your vital signs. They’re the specific, agreed-upon numbers you’ll watch to gauge the health of your data. A good KPI is simple, tied directly to a business outcome, and easy for anyone from the data steward to the CEO to understand.
If you’re running an ecommerce operation, your data quality KPIs could look something like this:
These aren't just vanity metrics. They give you a real, tangible way to see the impact of your work. Watching your completeness score climb from a mediocre 70% to a solid 95% isn't just a number on a screen. It's a clear win the whole team can get behind.
A data quality score is a brilliant way to cut through the noise. It bundles all your separate KPIs into a single, straightforward grade for your data's overall health. This gives you a high-level snapshot you can share with leadership and monitor week over week.
Think of it like a credit score for your data. A single number quickly tells you if things are healthy, need a little work, or are in the red zone.
For example, you might weigh different dimensions to calculate a score out of 100. A product could earn 30 points for being 100% complete, 30 for verified accuracy, 20 for valid formatting, and 20 for having up-to-date images. This approach makes it incredibly easy to pinpoint which products or categories are dragging down your average.
When your data is trustworthy, it fuels better data-driven decision-making across the entire company.
Trying to track KPIs in a spreadsheet is a slow, painful path to burnout. It's a manual chore that's already obsolete. Modern platforms like NanoPIM automate this whole process, giving you a live view of your data health without any extra effort.
NanoPIM comes with built-in dashboards that visualize your most important metrics in real time. You can see your catalog’s overall completeness score at a glance, drill down to the exact products that need fixing, and track improvements day by day.
It turns measurement from a dreaded monthly report into a live, automated background process. You can even set up alerts to ping a Data Steward the moment a product’s quality score drops below a certain threshold. This makes it easy to prove the ROI of your data quality framework and keeps the entire team focused on getting better every single day.
For more ideas, you might want to check out our other resources on key data quality metrics.
It’s one thing to talk about a data quality framework, but how do you actually build one without grinding your entire operation to a halt? The answer is to stop thinking of it as a single, monumental task and start treating it like a project with clear, manageable phases.
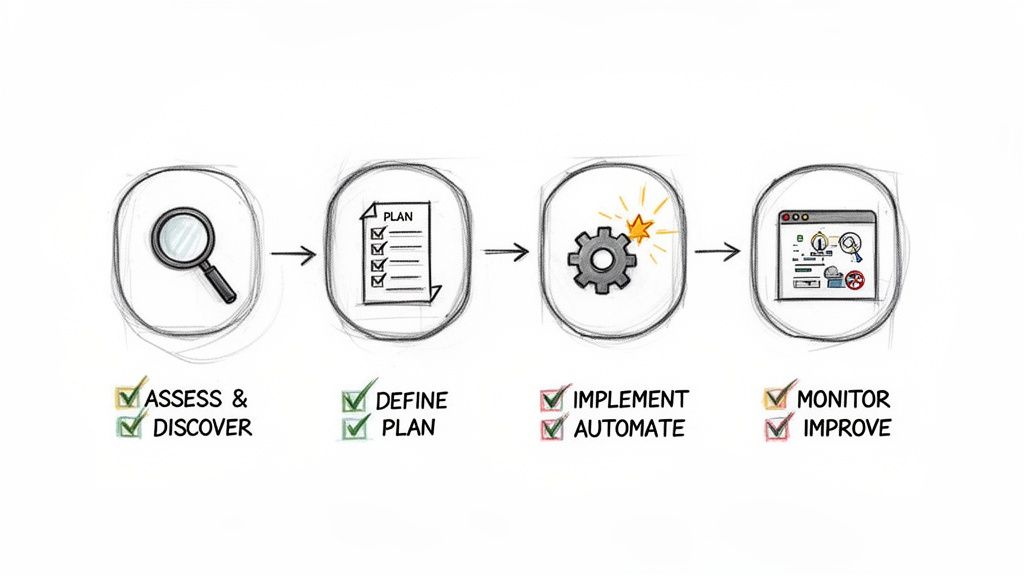
Breaking the work into a simple roadmap makes the whole process feel less like boiling the ocean and more like a series of achievable wins. We’ll walk through a four-stage journey to get your framework built and running.
This roadmap is all about building momentum. Each stage gives you something tangible, helping you get buy-in and prove the value of your efforts every step of the way.
You can’t fix what you don’t understand. This first stage is pure investigation. Your only goal here is to get an honest look at your data and pinpoint where the biggest problems are hiding.
Think of it like being a detective showing up at a crime scene. You’re there to gather evidence, assess the situation, and identify the main culprits causing the chaos. This discovery work is essential for aiming your resources where they’ll make the biggest difference.
Here’s your plan of attack for this stage:
With the evidence in hand, it’s time to build your case. This stage is all about deciding what "good" looks like and creating a concrete plan to get there. You’ll set clear goals, define your standards, and get your tools ready for action.
Essentially, you’re translating the problems you uncovered in Stage 1 into a set of rules and metrics you can actually track. This is where your framework starts to feel real.
Here’s your checklist for the planning phase:
Now it's time to get your hands dirty. In this stage, you’ll start cleaning up your existing data and, more importantly, put systems in place to keep it clean from now on. The focus shifts from planning to doing.
The role of automation here can't be overstated. As AI reshapes the world of commerce, manual data entry and fixes are becoming completely unsustainable. Businesses are already struggling with a major IT skills shortage, and you simply can't hire enough people to keep up. If you're curious, you can dig deeper into why data quality is crucial for AI success.
Your implementation tasks should include:
This stage is where your data quality framework transitions from a document into a living, breathing part of your daily operations. It’s the moment your team starts using the system you designed.
A data quality framework isn’t a project you finish; it’s a system you maintain. This final stage is a continuous cycle of tracking your results, learning what works, and refining your approach over time.
You'll lean on the KPIs you set back in Stage 2 to measure your success and spot new areas for improvement. This is how you keep your data healthy and ensure the framework evolves right alongside your business.
The ongoing process looks like this:
Starting a data quality journey can feel like a big leap, and it's natural for questions to pop up. We get it. Here are the honest answers to the most common questions we hear from businesses just like yours, designed to help you move forward with confidence.
This is the big one. When you're staring at a mountain of messy data, the task can feel completely overwhelming. The secret is to resist the urge to fix everything at once. Instead, start small with a high-impact pilot project.
For an ecommerce business, this might be your single top-selling product category. Or maybe it's just your Amazon listings. Isolate that one area and perform a data quality assessment.
The goal is progress, not perfection, on day one. A small win builds momentum and proves the value of investing in a data quality framework.
A tool like NanoPIM's Data Holding Bay is perfect for this. It lets you pull in a chunk of data to analyze without touching your live systems. Look for the most common problems. Missing images? Inconsistent brand names? Incomplete specs? Pick just one or two of those critical issues and fix them for that single category. This gives you a quick, tangible win, shows stakeholders what's possible, and gives you a blueprint you can use as you expand to the rest of your catalog.
The cost can swing wildly, but it really boils down to three things: people, processes, and technology. "People" costs are about training and dedicating staff time to data stewardship. "Process" costs are mostly the time it takes to define your rules and standards.
The biggest variable has always been "technology." Traditional on-premise solutions used to mean massive license fees, hardware costs, and painfully long implementation projects. Thankfully, modern cloud-based platforms have completely changed the game.
For example, NanoPIM runs on a transparent, token-based pricing model. You only pay for what you actually use: storage, AI actions, and data syncing. This model ties your costs directly to your business activity, so it scales up or down with you. You can start small, and your costs will naturally flex with seasonal demand or as your catalog grows. It removes the huge upfront investment and makes enterprise-grade data quality accessible, even for smaller, growing teams.
This is a great question, and the skepticism is healthy. The truth is, AI is an incredibly powerful tool, but it isn't magic. It absolutely needs a framework to be effective. If you just point an AI at low-quality data, it’s going to give you low-quality results. That’s exactly how you get "hallucinations" or nonsensical product descriptions.
But, when you use AI inside a strong data quality framework, it becomes a massive accelerator. It’s built to do the repetitive, scalable work that would crush a human team.
Here’s how it works in practice:
So, AI doesn't replace the need for a framework; it supercharges it. By automating the grunt work, you free up your team to focus on strategy and the more complex quality challenges, making your entire operation smarter and more efficient.
Ready to build a data quality framework that drives real results? NanoPIM provides the tools, automation, and governance features you need to centralize, enrich, and optimize your product information. See how NanoPIM can transform your data today.


